SeasonalJul 16, 2026·10 min read
Back to School Amazon Deals Worth Buying in 2026
Back-to-school season is loud on Amazon. Here is how we separate real savings on supplies, tech, and dorm gear from inflated sale badges.
Read article#ad As an Amazon Associate, we earn from qualifying purchases.
Learn how to read Amazon price history, spot fake discounts, and decide whether today's price is actually a deal.
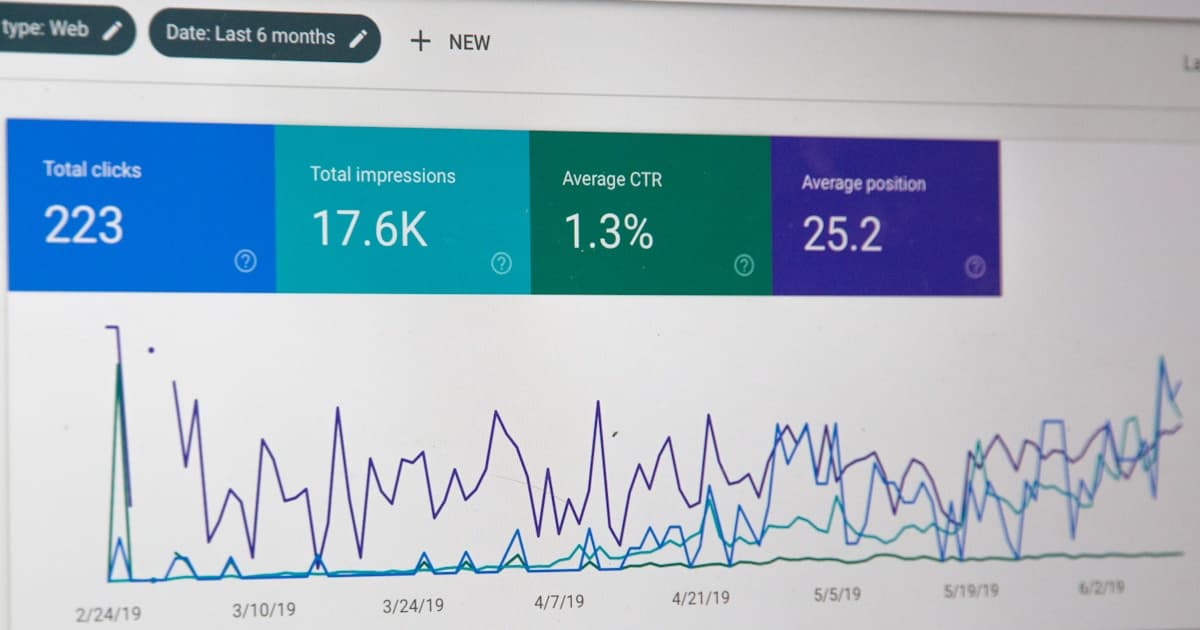
Amazon is excellent at showing you the price right now. It is less interested in showing you whether that price is special. A bright percentage off a Was figure can look like a victory while sitting above the average you would have paid last month. Price history closes that gap.
Every deal we take seriously at SnipBucks gets checked against recent pricing context. You do not need a finance degree to do the same. You need a chart, a few rules of thumb, and the discipline to walk away when the story does not add up.
A good history view shows how an ASIN's offer price moved over 30, 90, or 180 days. You can see seasonal dips, temporary spikes, and long flat stretches. The useful question is not Did this ever cost more? Almost everything did. The useful question is Is today's price meaningfully better than the recent normal?
Watch for a spike followed by a discount back to baseline. That pattern is classic fake sale behavior. Also watch for a true step-down that holds for days. Those are often inventory pushes or real promotions worth acting on if you already wanted the item.
Prices rise into a major event, then a sale returns them near the old average with a dramatic badge. If the chart shows the pre-spike level clearly, you are mostly paying normal again. Patience usually beats the badge.
Older electronics and seasonal goods often drift lower over months. Buying the first 10% drop may leave money on the table. If you can wait and the product is not scarce, let the bleed continue until it flattens or hits your number.
A sharp drop to a level the item has rarely or never hit is the pattern we like most. Pair it with strong reviews and a trusted seller, and you have a classic SnipBucks-style deal. Still read the listing. Wrong size and open-box surprises happen.
History cannot tell you if a product is good. It cannot fix a counterfeit risk. It cannot predict tomorrow. It also gets messy when multiple sellers rotate on one listing. Always glance at who fulfills the order at the price you are comparing.
SnipBucks tip
Our deal pages emphasize price context so you spend less time guessing. If a drop looks weak against recent history, we would rather skip it than publish noise.
You do not need to chart every $12 impulse buy. You should chart anything expensive, anything marketed as a limited-time steal, and anything you can wait a week for. Five minutes of history beats five months of mild regret.
Sale badges shout. Charts whisper. Learn to listen to the whisper.
Updated July 13, 2026 · Affiliate disclosure
Back-to-school season is loud on Amazon. Here is how we separate real savings on supplies, tech, and dorm gear from inflated sale badges.
Read article
Pet supplies are perfect for recurring delivery if you shop carefully. Here is when Subscribe and Save wins, and when a one-time deal is smarter.
Read article
Smart plugs and bulbs go on sale constantly. Cameras and hubs are a different story. Here is how we decide which smart home deals are actually worth it.
Read article